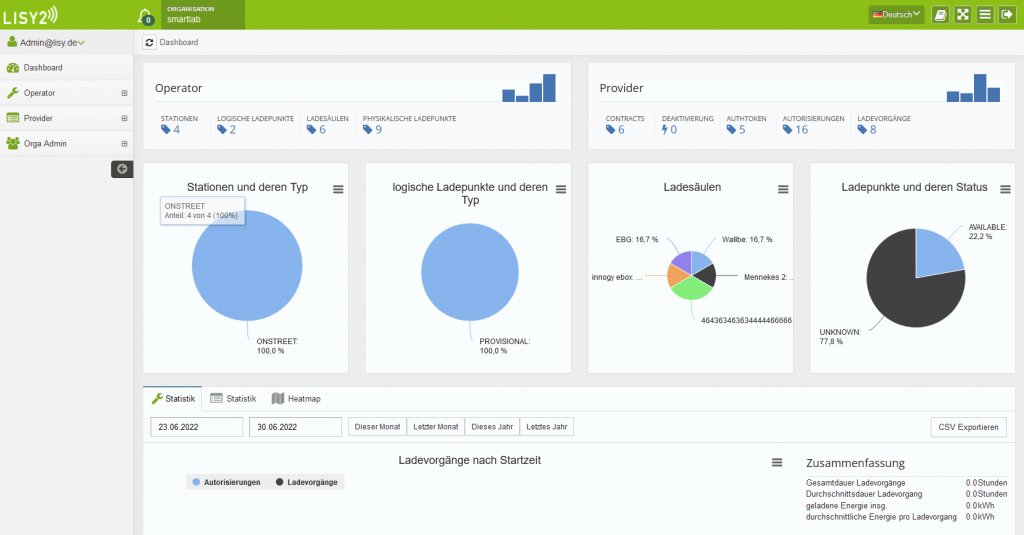
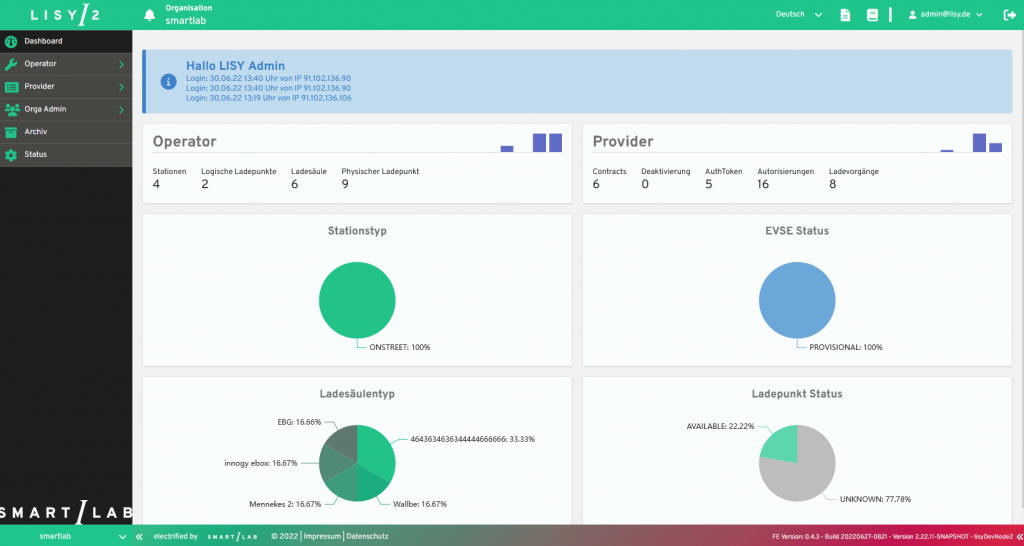
The strategy for the creation of the new frontend was mainly to bring the view and the design to a modern level and to optimize the connection to the backend. The menu structure was kept, the most fundamental changes were made in the background. This is mainly to increase performance and user-friendliness.
New features were reduced as much as possible due to their complexity, in order to achieve the fastest possible move to the new frontend.
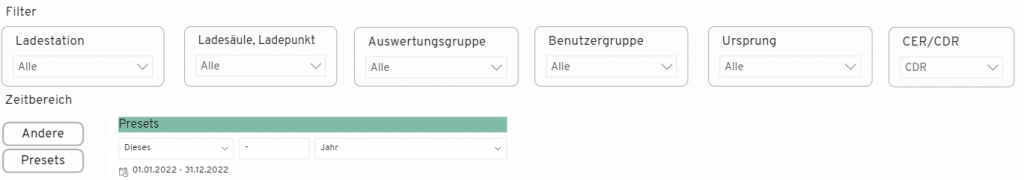
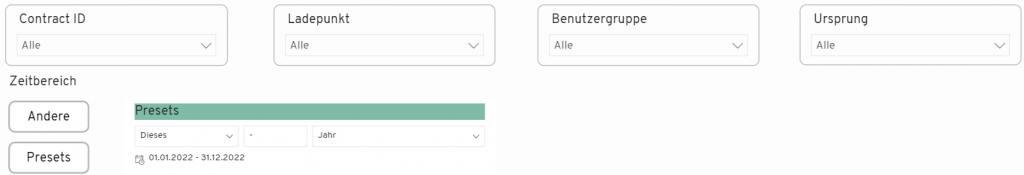
The filter function in LISY2 has been adapted in all tables. Thus, all filters are now stored in the cache and are still available after navigation to another menu item or a logout. Via a button all set filters can be reset or completely hidden.
Stations
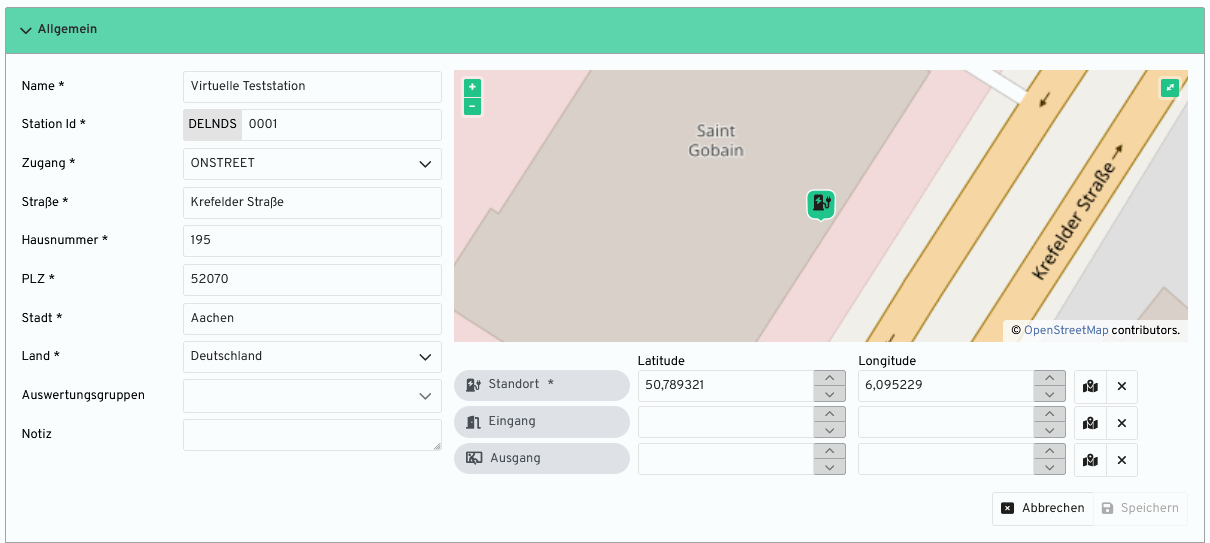
For stations 3 coordinates can be stored, the location of the station, the entrance and the exit, if this should deviate substantially. Use cases can be company premises or parking garages. If the system recognizes the address, a marker can be created automatically on the map for all 3 locations by pressing a button. All markers can be moved manually on the map with the mouse.
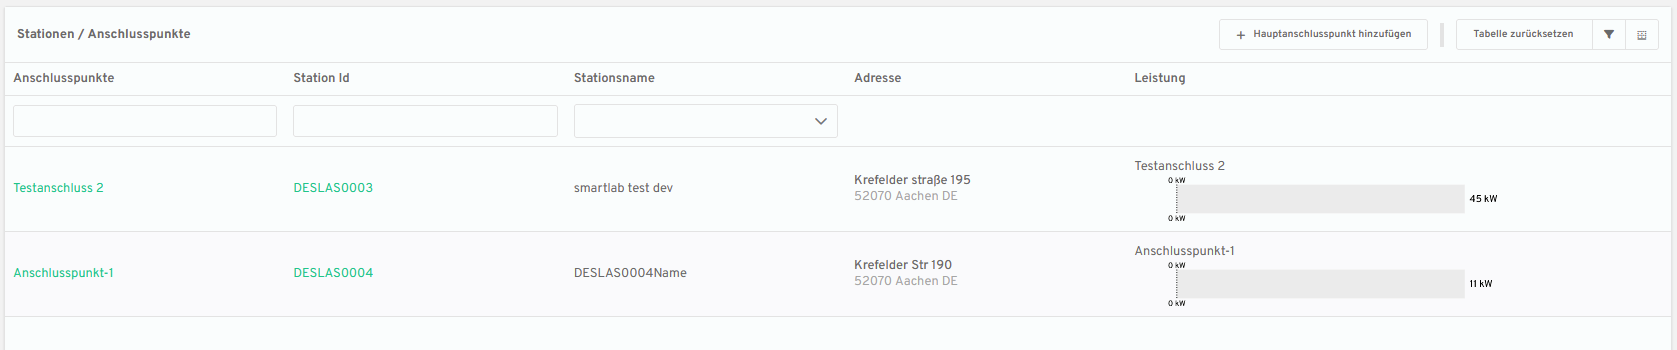
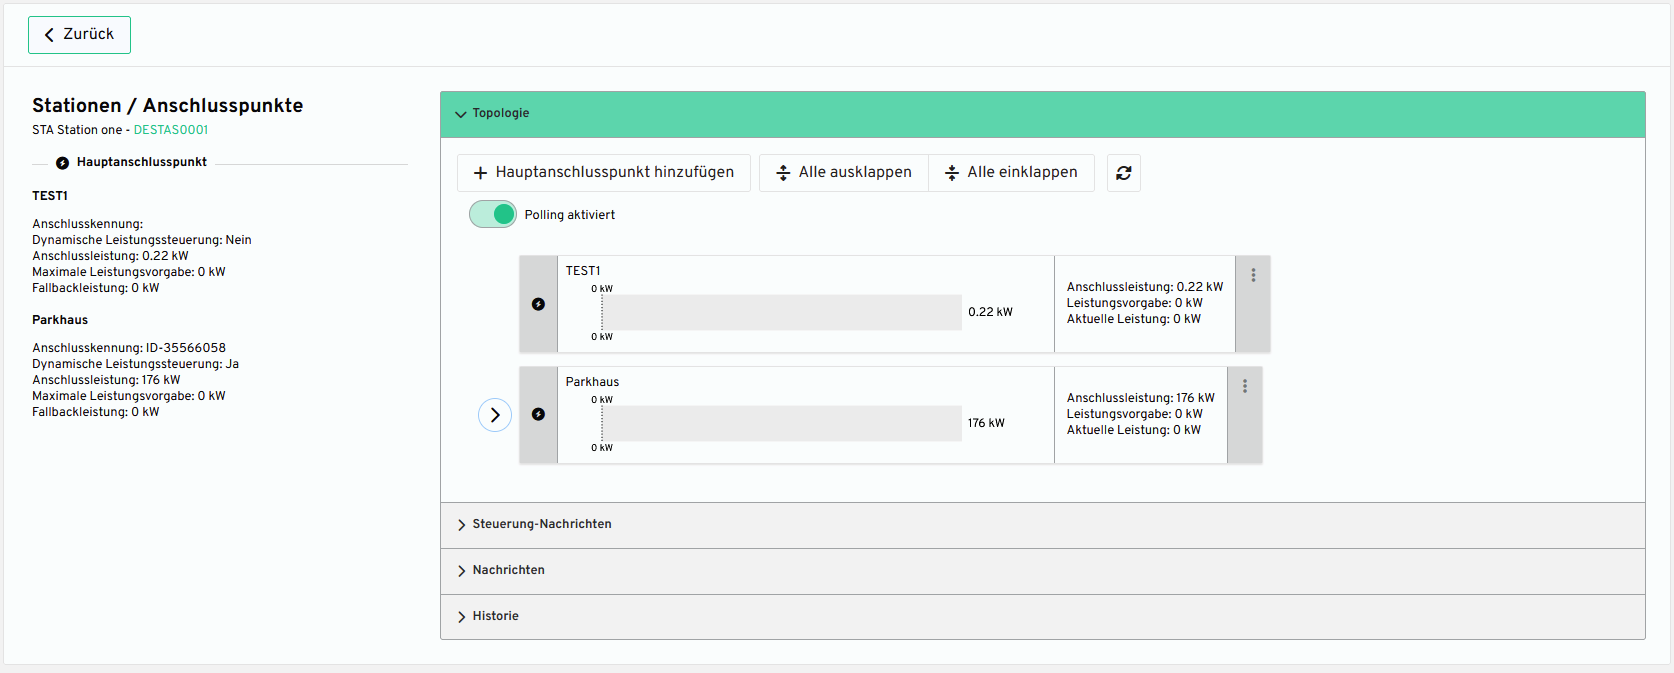
The detail page of the connection points shows running updated the performance per main connection point or more detailed per sub-connection point or charging point. Filtered to the station, all messages and control messages are also made visible separately in a submenu item.
Archive
A central area for all entities. The archive has been redesigned as an additional menu item so that, depending on the user role, the different tabs represent the deleted entities.